Debugging a Script
This page goes over how to debug common problems you may run into while using InDesign Scripting.
- The UXP logs and console.log from script gets written to path
/Users/<user name>/Library/Caches/UXPLogs/in Mac andC:\Users\<username>\AppData\Local\Temp\UXPLogsin Windows. If you find multiple files in the location, pick the one with the latest timestamp. - All the sample scripts have a try /catch block. Any exceptions raised from the InDesign side can be caught and dumped to the console or displayed on the dialog box.
- Interpreter parsing errors go directly to the UXP logs.
- User can print any message using ‘console.log(formatted message). Messages will appear in a log file.
Debugging Script files using UDT
Script files are executed in a context that is mostly the same as those used in UXP plugins. Using UXP Developer Tool (UDT) version 1.7.0, you can step through and debug a script.
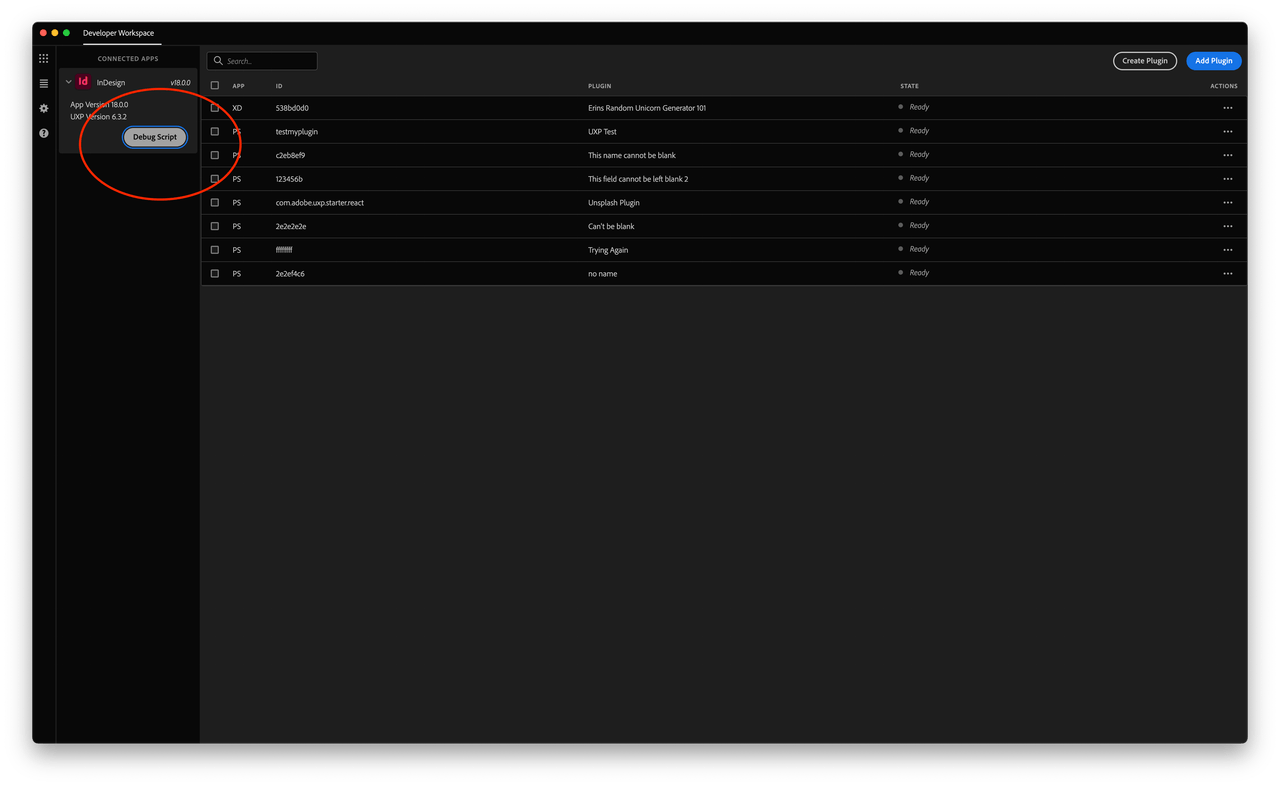
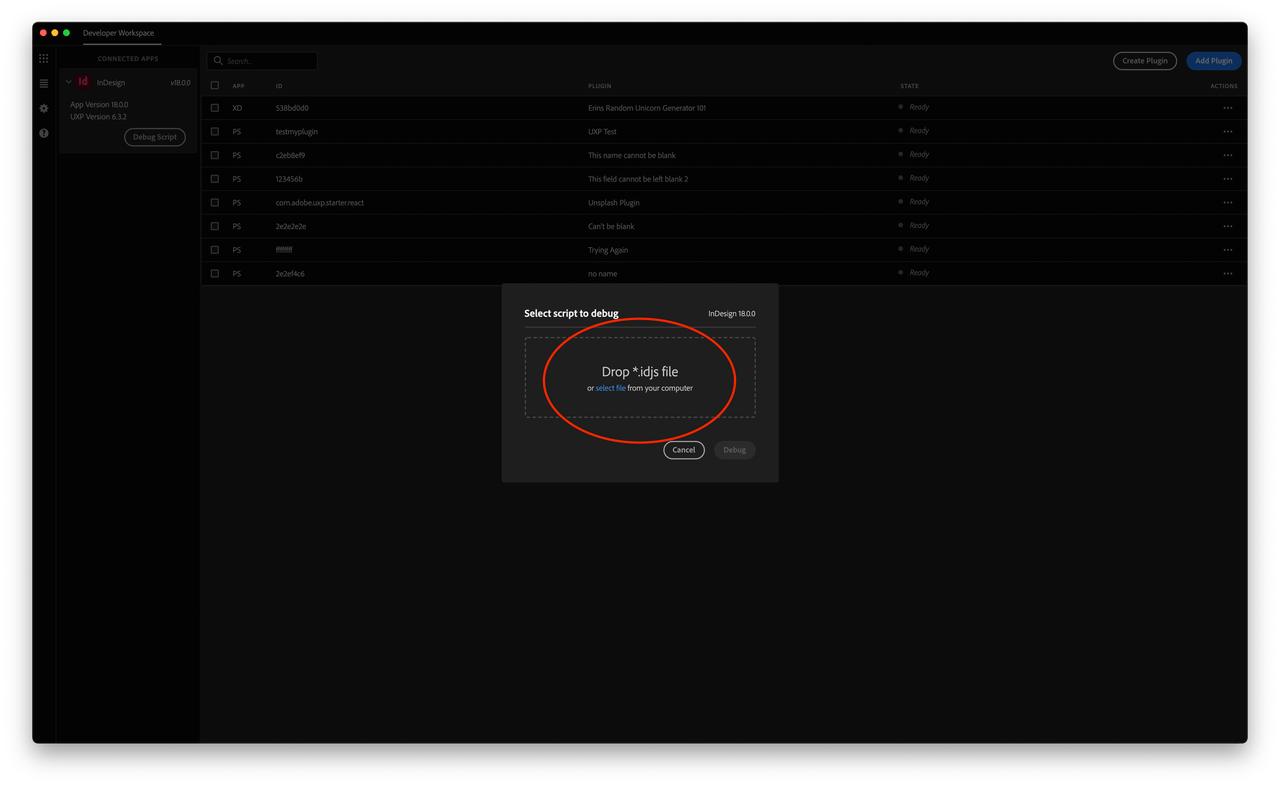
You can debug script files in UDT by clicking on "Connected Apps", choosing InDesign, and then adding your script from there:


Once you've loaded a script in, you can debug with a breakpoint activated. From here you set breakpoints or Step Into the script files.