Debugging a Script
This page goes over how to debug common problems you may run into.
Quick tips for logs:
The UXP logs and
console.logfrom scripts get written to the following locations
For the InDesign versions below 19.2 -- macOS:
/Users/<user name>/Library/Caches/UXPLogs/ - Windows:
C:\Users\<username>\AppData\Local\Temp\UXPLogs
From InDesign 19.2 version onwards log paths have changed as below -
- Adobe InDesign -
macOS:/Users/<user name>/Library/Logs/Adobe/Adobe InDesign <InDesign version year>/
Windows:C:\Users\<username>\AppData\Roaming\Adobe\InDesign\Logs - Adobe InDesign Server -
macOS:/Users/<user name>/Library/Logs/Adobe/Adobe InDesign Server <InDesign version year>/
Windows:C:\Users\<username>\AppData\Roaming\Adobe\InDesign Server\Logs
If you find multiple files in the location, pick the one with the latest timestamp.
- macOS:
All the sample scripts have a try/catch block. Any exceptions raised from the InDesign side will be caught and dumped to the console or displayed on the dialog box.
Interpreter parsing errors go directly to the UXP logs.
Debugging Script files using UDT
Script files are executed in the same context as UXP plugins. Using UXP Developer Tool (UDT) v1.7.0, you can step through and debug a script.
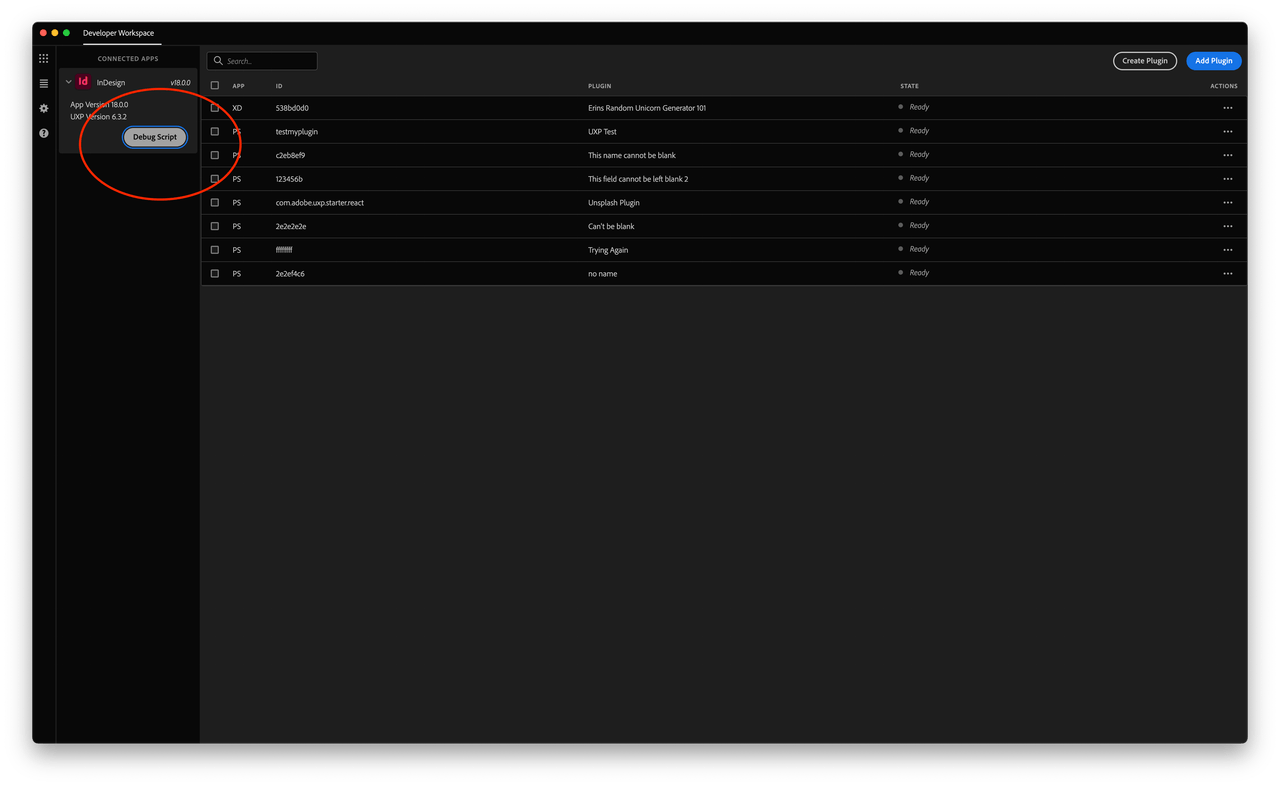
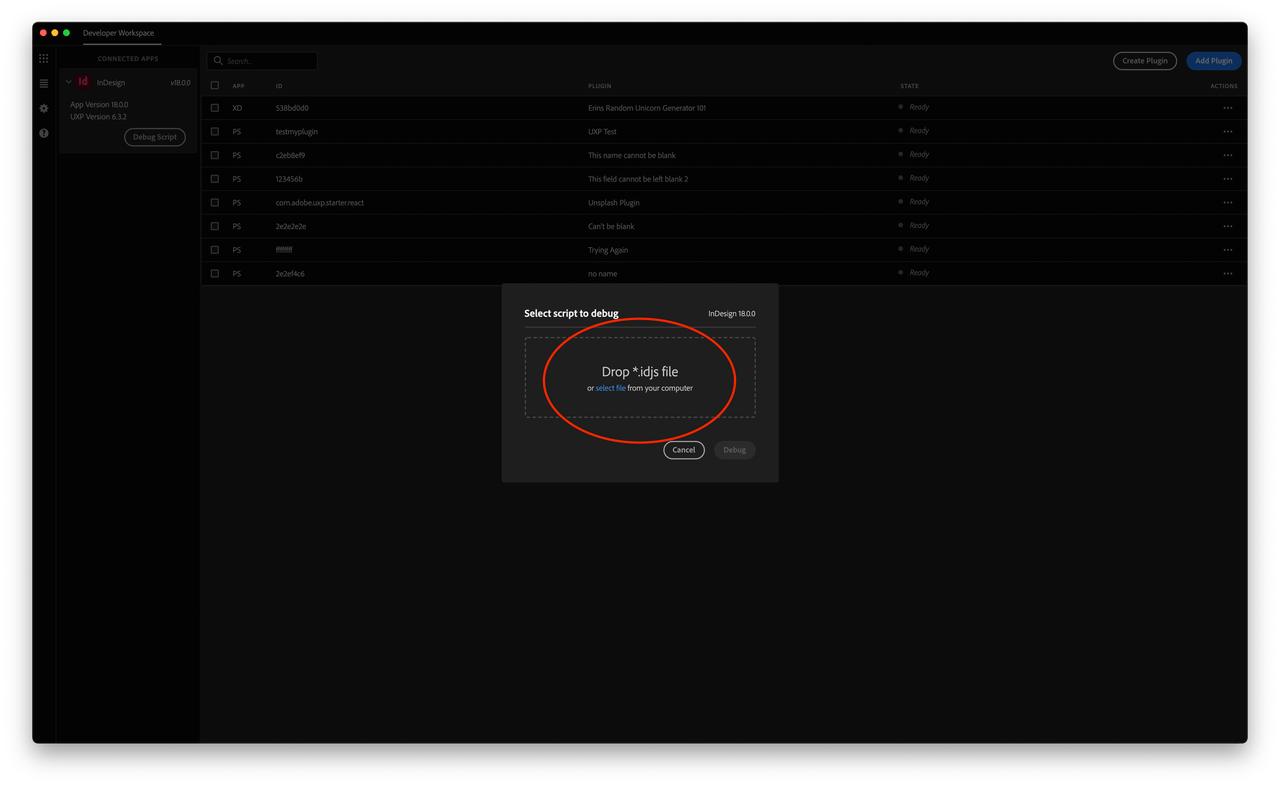
You can debug script files in UDT by clicking on "Connected Apps", choosing InDesign, and then adding your script from there:


Once you've loaded a script in, you can debug with a breakpoint activated. From here you set breakpoints or Step Into the script files.
