How to Debug Your Plugin
Bugs happen! In this tutorial, you will learn how to debug your Adobe XD plugin.
Prerequisite
At least one plugin created and added to the UXP Developer Tool.
Debugging Options
To debug your Adobe XD plugins, you'll be using the UXP Developer Tool. However, you can glean some useful information by using the built-in Developer Console provided by Adobe XD. (Note that this is a legacy feature and will be going away in the future.)
Debugging with the UXP Developer Tool
1. Load your plugin
- If you haven't already, launch the UXP Developer Tool application.
- Next to the plugin you want to debug, find the ••• button and click it. Select Load to load this into XD.
2. Launch Debugger
- Click ••• > Debug. This will launch a Chrome Developer Tools environment that you can use to debug your plugins.
What works, what doesn't
Currently, you can...
- Set breakpoints, pause & step through code, inspect the values of variables
- View objects and run code in the Console view
- View and edit the DOM structure of your plugin's UXP UI
- View networking requests (for XHR,
fetch, and Websockets only)
Important caveats:
- XD may be unstable while debugging a plugin. Don't debug when you have important XD documents open.
- Error messages are often missing from the DevTools Console. Use the Developer Console within XD to be sure you are not missing any important information.
- XD will be partially frozen while paused on a JS breakpoint. Don't try to interact with XD while paused.
- You may see a blank white panel to the left of the DevTools UI. Ignore this, as it does nothing.
- If debugging exposes any private fields and methods, do not attempt to use them. Plugins referring to private APIs may be rejected or removed from the plugin marketplace.
Quick debugging with Developer Console
1. Check the Developer Console
In XD, click Plugins > Development > Developer Console (Legacy).
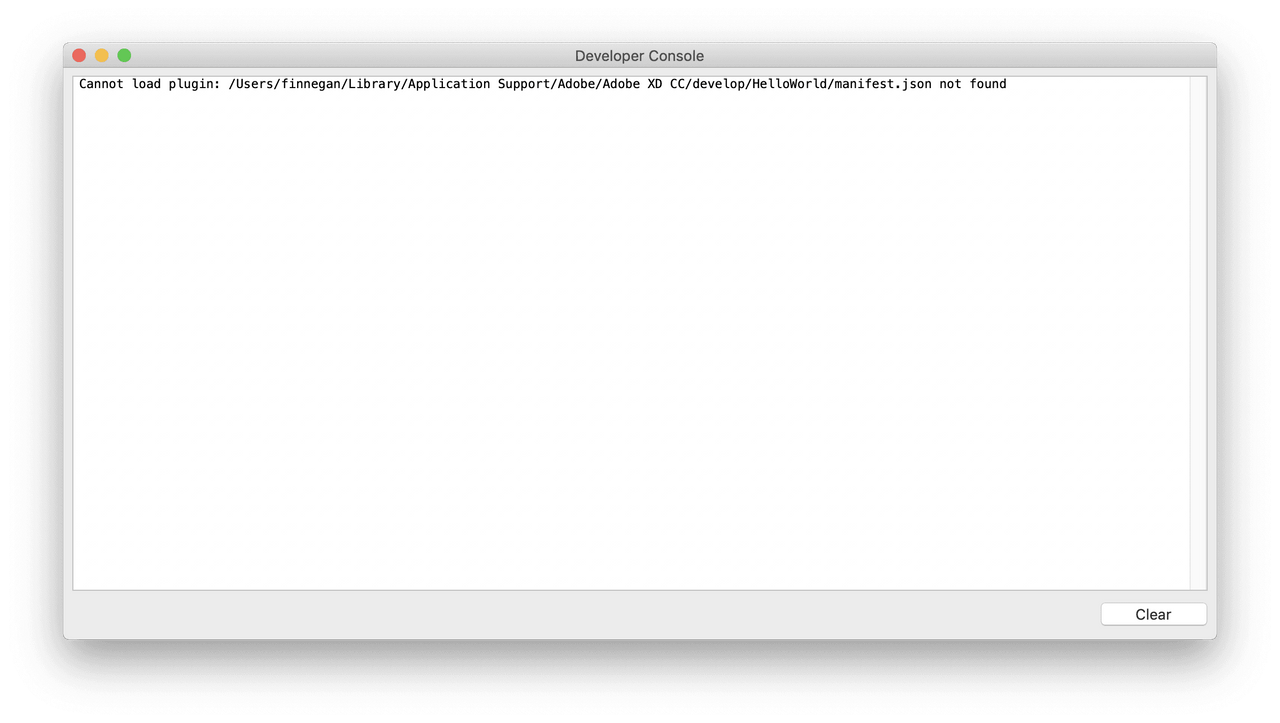
This displays information similar to what you'd find in the JS debugger's console view:
- Any
console.log()output from your plugin - Any error messages from XD due to plugin misbehavior, or failure to load a plugin
- Stack traces if your code throws an uncaught exception
The console output for all installed XD plugins is mixed together in one single view here.
2. Reload your plugin after making fixes
Note: The develop folder can be used during plugin development, and is the only folder XD will reload plugins from when you reload plugins from the Plugins menu. XD makes it very easy for you to get to the develop folder: simply go to this menu item: Plugins > Development > Show Develop Folder.
You can easily iterate on your plugin code without having to restart XD. Switch to the UXP Developer Tool, and click Actions > Reload All, which will force the developer tool to reload all loaded plugins.
There's also a handy keyboard shortcut in the UXP Developer Tool to make reloading easier:
| Platform | Keyboard shortcut |
|---|---|
macOS | Shift-Cmd-R |
Windows | Ctrl-Shift-R |
If there are any errors blocking the plugin from loading, they will appear in the Developer Console on reload:


